Proving cause without new experiments: what Kota's tuition centres can tell us about class size
The STAR project's findings on class size are contested because of possible Hawthorne effects. A coaching school in Kota that splits students into different-sized batches by an entrance exam could answer the same question, with no new experiment. A research design from Oxford, 2020.
Written at Oxford in 2020 for a course on identification: how to show that one thing causes another. Lightly edited for this site in November 2026, with a section at the end on what I would change now. This is a proposed research design. I never collected the data, so there is no result.
Introduction
The STAR project attempted to find the causal link between class size and student performance using randomised controlled trials. While the outcomes showed smaller classes improve student performance, the study was criticised by some because of a high probability that the outcomes were skewed in favour of small classes by Hawthorne effects.
This piece looks to answer the same question, but proposes using the regression discontinuity method to measure the performance of students at a coaching school in India which splits them into different-sized groups based on an entrance exam. If successful, this approach would be unburdened by Hawthorne effects.
The basic identification problems
Finding the causal effect of small classrooms vs. lecture theatres presents interesting identification challenges. Given this piece is responding to the STAR project, this section looks at identification problems in its context, and the next section shows how these and other problems would be addressed by the alternative approach using regression discontinuity.
Let us take:
- y(1,i) to be the outcome for subject i when treated, i.e. in a small classroom (30 students in our study, introduced in the next section), and
- y(0,i) to be the outcome in the untreated or control case, i.e. in a large classroom (100 students in our study).
The treatment effect is then Δ(i) = y(1,i) − y(0,i).
The basic identification problem arises because subject i cannot be in both the smaller class (treatment) and the larger class (control) during an observation period, making it impossible to find the treatment effect with that single subject. However, given reasonable assumptions, we might be able to observe one and infer the other, thereby estimating the causal relationship by finding out what would have happened to subject i if we had put them in a smaller class rather than a larger one.
Heterogeneous treatment effects can also cause identification problems, where the distributions of y(1,i) and y(0,i) vary across subjects, and they must be avoided. For example, older students such as university undergraduates might show a treatment effect of much smaller magnitude in small classes than younger students in kindergarten or first grade. Here, the treated outcome for i (a college undergraduate in a small classroom) vs. the untreated outcome for j (a kindergarten student in a large classroom) will not give a valid estimate of the effect of class size on student performance.
To estimate causality, the stable unit treatment value assumption must hold as well: the treatment of subject i must not affect the outcome of untreated subject j. This might be violated where one teacher teaches both a smaller and a bigger class, and uses the time saved by finishing the small class's curriculum quickly to give extra support to the larger class.
Lastly, the STAR project used randomised controlled trials to account for most of these identification issues. The only problem is that it was not double blind. Teachers knew they were participating in an experiment which might determine class sizes in the future, and it was in their personal interest to make it look like small classes improve student performance and that teacher aides have no effect. Hawthorne effects thus likely impacted this study in favour of small classes.
Using regression discontinuity to find the answer
Kota, in Rajasthan, is the tuition city of India. 150,000–200,000 students from all over the country travel to the city each year to study at its premier full-time coaching institutions, preparing for the IIT-JEE entrance exam to get into the country's premier engineering colleges (Chhapia, 2018). It is such a competitive industry that many tuition schools have admission tests for entry, and offer scholarships to the most promising students (Resonance Eduventures, 2019).
Once a student is admitted, the competition and segregation continue. Most of these institutions break up their students into high-potential and low-potential batches based on more test results. High-performing students receive some form of preferential treatment.
At Vibrant Academy, considered one of the best institutions in Kota, an entrance exam taken when students enter grade XI determines which batch they join to prepare for the IIT-JEE. Until 2015, batches were allocated as follows, according to student rank in the entrance exam (Dubey, 2017).
| Batch | Students | Entrance exam ranks |
|---|---|---|
| P1 (top batch) | 30 | 1–30 |
| P2 (second batch) | 100 | 31–130 |
| E1, F1, G1, H1 | 100 each | 131–530, dealt in turn: 131 to E1, 132 to F1, 133 to G1, 134 to H1, 135 back to E1, and so on |
Ranks below 530 were distributed the same way into batches E2, F2, G2 and H2 (100 students each), ranks below 930 into E3, F3, G3 and H3, and so forth. The total number of students allocated to batches this way at Vibrant Academy is approximately 2,000–2,500 a year, all of whom take the IIT-JEE exam together the following year (Vibrant Academy, 2019).
Batches P1 and P2 share the senior-most teachers (Heads of Department, or HODs), with the only difference between the two groups being the size of the class: P1 has 30 students, while P2 has 100 (Dubey, 2017). These are the only batches relevant for our study, as class size is the only treatment that differs between them before the outcome variable, the marks earned in the IIT-JEE exam. However, this is only true at Vibrant Academy before 2015, as after that year batches P1 and P2 were changed to hold 50 students each (Dubey, 2017). Hawthorne effects are unlikely here, as the success of the school, and the compensation of the HODs, depends on maximising the total number of students selected after the IIT-JEE exam, and P1 and P2 both deserve their full attention as the most elite ranks in a cohort over 2,000 strong.
Batches E1, F1, G1 and H1 are guaranteed an HOD for only one of the subjects (maths, or physics, or chemistry), with the rest of the teachers in their batch being of lower quality. These batches are thus irrelevant for this study.
For the rest of the analysis, we will refer to batches P1 and P2 at Vibrant Academy in the years before 2015, as those are the only years in which a potential treatment effect of small class size would show in student performance.
There are two possible hypotheses:
- Hypothesis 1: smaller class sizes do not cause an improvement in student performance.
- Hypothesis 2: smaller class sizes do cause an improvement in student performance.
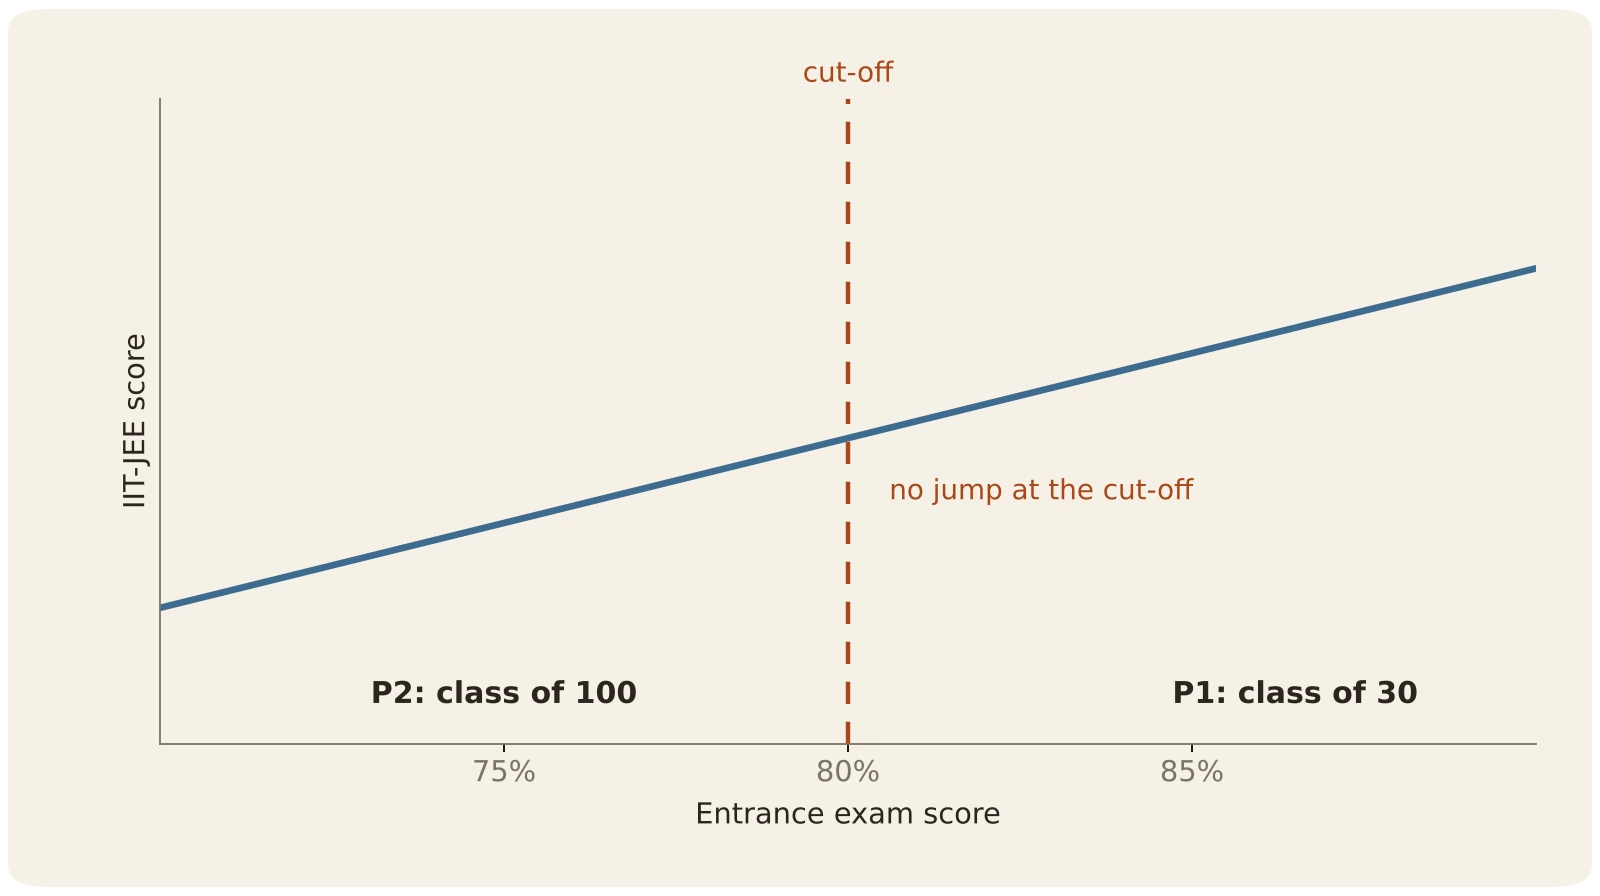
If hypothesis 1 is true and smaller classes have no effect on student performance, we can expect to see an unbroken linear relationship between entrance exam scores and IIT-JEE exam scores across batches P1 and P2, as shown below:
However, if a smaller class does cause student performance to improve, we would expect to see the IIT-JEE score jump up for batch P1 at the cut-off:
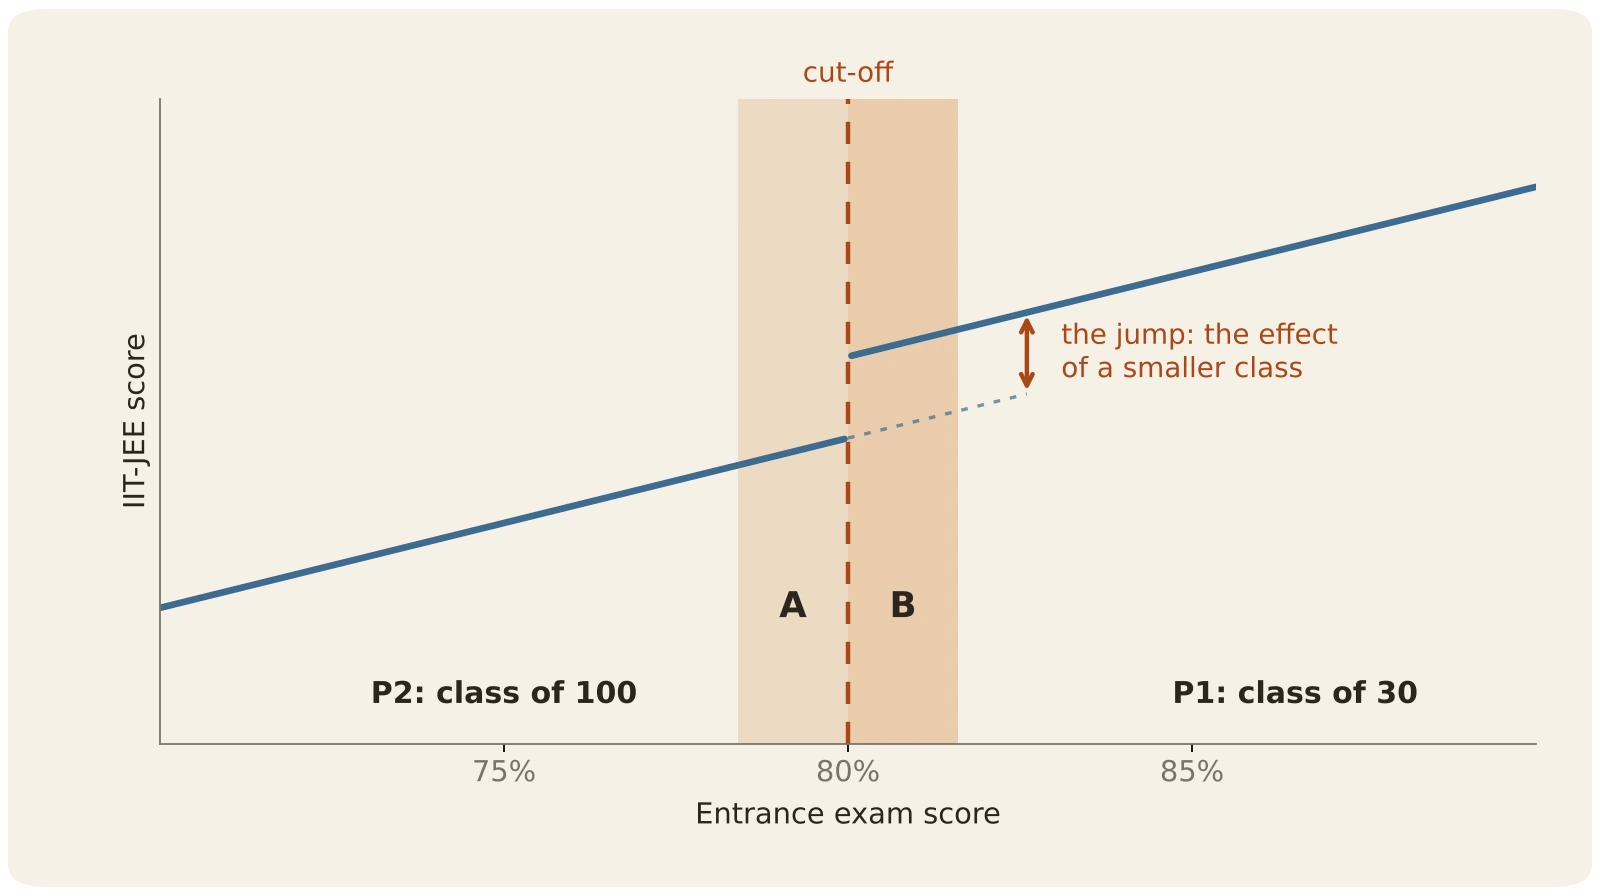
Here, comparing the average performance of all students in P1 to the average performance of all students in P2 would not give us an accurate estimate of the treatment effect. If we take the entire set of P1 and P2 into account, it is likely that edge-case students (the best performers in P1 and the worst performers in P2 on the entrance exam) have a genuine difference in aptitude. This would let confounding variables, beyond our treatment, influence the outcome.
We can apply the regression discontinuity approach to solve this problem and find the causal effect of smaller classes on student performance. Instead of comparing outcomes across the entire set of students, regression discontinuity compares the outcomes of students just below the cut-off in P2 (band A above) with students just above the cut-off in P1 (band B). The assumption is that these students are essentially at the same base level of performance in the entrance exam, with their slight difference attributable to randomness. For example, if a student scored 79.9% and just missed the cut-off, it is likely that on another day they would have scored 80.2% and been placed into P1, and the same is true in the opposite direction for someone who scored just above the cut-off.
This means we can compare the average outcome of all the students in band B with the average outcome of all the students in band A, and any difference between the two groups can be attributed to the fact that the students just above the cut-off were in a smaller class and the students just below it were in a larger one. So if the IIT-JEE score jumps at the cut-off between the untreated and treated side, by an amount that is significant at a high enough confidence level, there is a discontinuity in the regression line showing the causal effect of small classes on student performance (or a negative effect, depending on what the measured results turn out to be). Not only does this show whether a treatment effect exists and its direction, the size of the difference in IIT-JEE scores between the two groups also shows the magnitude of the effect of a small class on student performance.
It is important to note that A and B, the bands around the cut-off, would be determined entirely by what the actual data looks like. If the range between the entrance exam results of the topmost P1 student and the lowermost P2 student is 1%, the entire group of students might fall within the bands. If the range is closer to 20%, then A and B may cover 2% in either direction around the cut-off.
A surmountable challenge
The most challenging part of running this analysis is data collection.
It is unlikely that Vibrant Academy would provide data for its P1 and P2 batches for the years before 2015. Coaching institutions in Kota tightly control their marketing narrative, and their results are rarely published with the context or benchmark needed to judge them.
Luckily, there is an alternative way to source the data without going through Vibrant Academy directly. Every year Vibrant Academy, like the other coaching institutions, proudly displays on its website the names, photos, and IIT ranks of every student in its cohort who is selected after taking the final IIT-JEE exam: 1,182 selections in 2014, 1,243 in 2013, 1,472 in 2012 and 822 in 2011.
A researcher can start to reach out individually to the people on each year's list. As they get through to some P1 and P2 students, they can ask for their entrance exam scores, the cut-off for their year which separated P1 from P2, and their IIT-JEE exam scores. The researcher can also ask these students for the names of their batchmates to narrow down the outreach, and potentially use their help to connect directly with the relevant students.
In the four years with available data, the total population would consist of 120 P1 students and 400 P2 students. If the researcher can get records for most of this population, they will be able to use the regression discontinuity method described above, aggregating data across all four years. The entrance exam scores, P1/P2 cut-offs, and IIT-JEE exam scores would be normalised to account for variation from year to year.
If, however, the researcher is unable to get data from most of the population, they risk introducing selection bias into the analysis. For example, if only 50 of the 120 P1 students respond to the researcher's call to share their data, it is possible that they responded for a non-random reason (such as getting into their IIT of choice), and not by chance. If so, the values for the remaining 70 might be systematically under-represented relative to the true distribution. The researcher might be able to account for this possible selection bias using the Heckman correction, and then find the difference at the discontinuity on either side of the cut-off using the adjusted regression. Given my knowledge of India, I believe it likely that most P1 and P2 students would respond, and this step would not be necessary.
Conclusion
Where the STAR project's results are contested because of possible Hawthorne effects, this study might convincingly show a causal relationship between small class sizes and improved student performance, by using the regression discontinuity method to measure student outcomes at a coaching school in India which splits pupils into different-sized groups based on an entrance exam.
This subject would be worth pursuing for no greater reward than giving millions of teachers around the world evidence to put in front of their administrations.
What I would change now (2026)
Reading this six years later, I would make four changes.
The cut-off changes more than class size. I wrote that class size is the only difference between P1 and P2. It is not. A student who ranks 30th instead of 31st also gets much stronger classmates (the top 30, rather than ranks 31 to 130), and the label of being in the top batch, which can change how hard they work and how they are treated. A jump at the cut-off would measure all three together. The 2015 change may be the way to separate them: from then on P1 and P2 were the same size, but the classmates and the label still changed at the cut-off. The jump after 2015 would measure classmates and label alone, and the difference between the jumps before and after 2015 would estimate the effect of class size. This is called a difference in discontinuities.
The sample near the cut-off is small. With 30 students in P1 a year, only a handful sit close to the cut-off each year, so even four years of data would give a noisy estimate.
The data should come with consent. Today I would ask an institution to share anonymised records under India's Digital Personal Data Protection Act of 2023, rather than contact students one by one from published lists.
Others had used the idea first. In 1999, Joshua Angrist and Victor Lavy used a rule in Israeli schools, which splits any class of more than 40 pupils, to study class size in exactly this way. Angrist shared the 2021 Nobel prize in economics for work like this. I should have cited them.
The idea matters more to me now than the design. Rules that sort people by a cut-off create natural experiments, and the data to read them often already exists. India is now creating such data at a scale it never had: Bharat-VISTAAR, launched in February 2026, gives farmers AI advice on weather, crops and prices, and is reaching farmers in phases. With care, and with farmers' consent, that data could show which advice actually raised a harvest. I first went looking for what raises farmers' incomes in 2019; you can read what I found on Gyan Garg's farms.
Bibliography
- Angrist, J. D. & Lavy, V., 1999. Using Maimonides' rule to estimate the effect of class size on scholastic achievement. Quarterly Journal of Economics, 114(2), pp. 533–575.
- Chhapia, H., 2018. Why Kota may be a bad place for your child. Times of India
- Dubey, P., 2017. How are batches allotted at Vibrant Academy for micro program? Quora
- Resonance Eduventures, 2019. soNET 2019-20: Resonance Admission, Entrance & Scholarship Test. YouTube
- Vibrant Academy, 2019. List of our students selected in IIT-JEE 2019. Website